In October 2024 Adu presented on "GIS-based mini-grid wind energy geographical economic potential assessment: A case study of Ethiopia" at the conference at Rutgers University in New Brunswick, USA. Adu provides an overview on the presentation given in the blog below.
Ethiopia, with a population exceeding 126 million as of 2023, faces significant challenges and opportunities in the energy sector, particularly in expanding access to electricity. As of 2022, only 54.2% of the population had access to electricity, highlighting the need for innovative solutions to bridge this gap.
Ethiopia's energy mix is heavily reliant on hydropower, which accounts for 92% of its electricity generation. Wind power has emerged as a promising alternative, contributing 7% to the energy portfolio, while geothermal resources add another 1%. Despite these renewable resources, Ethiopia has one of the lowest levels of electricity consumption in Sub-Saharan Africa, and biomass remains a substantial part of the energy supply mix.
Leveraging GIS and OnSSET
This study employs GIS tools alongside the OnSSET (Open Source Spatial Electrification Tool) methodology to evaluate the geographical economic potential of mini-grid wind turbines potential of 600 W/ m² wind turbines at a hub height of 55 meters across Ethiopia. The methodology identifies suitable locations for wind turbine deployment based on various geospatial factors, including:
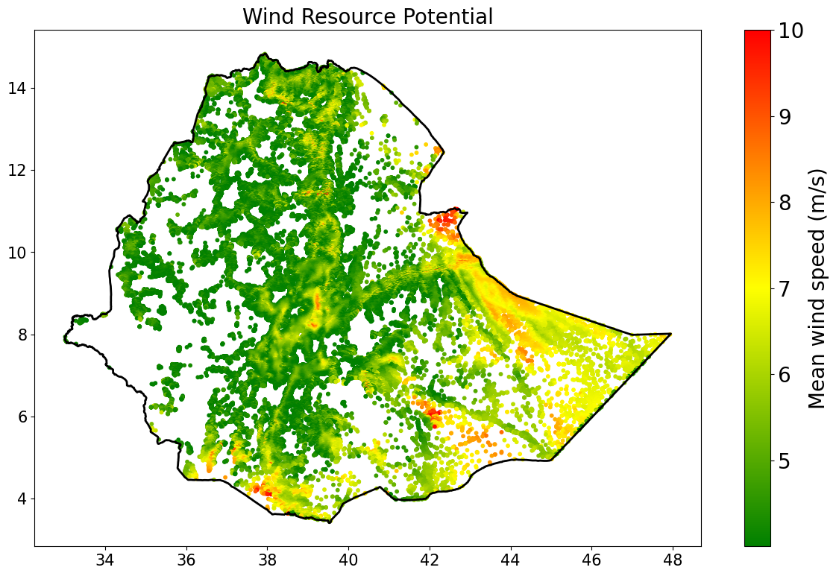
- Wind Speed: Settlements with wind speeds exceeding 4 m/s are filtered, as this threshold is generally considered necessary for effective energy generation from wind turbines (see Figure 1).

Figure 1: Wind speed (m/s) distribution in Ethiopia.
- Land Cover: Suitable land cover types, such as open shrublands, savannas, grasslands, and barren lands, are filtered to minimize ecological disruption while maximizing energy potential.
- Terrain Slope: Terrain slopes are assessed, with a preference for locations below 10 degrees to facilitate the installation and maintenance of wind turbines.
- Proximity to Infrastructure: The distance from roads (within 1 km considered suitable) is evaluated to ensure accessibility for construction and maintenance activities.
- Human Settlements: Settlements comprising more than 100 households are considered suitable, ensuring that the energy generated could directly benefit local communities.
Through these criteria, delineating potential sites for mini-grid wind energy deployment.
Economic Viability: The Levelized Cost of Energy (LCOE)
The Levelized Cost of Energy (LCOE) is used as a key metric for assessing the economic feasibility of mini-grid wind power. The LCOE represents the total lifetime cost of generating electricity divided by the total electricity produced, providing insight into the minimum price at which electricity must be sold to break even. The parameters considered in the analysis include in the table below:
|
Parameter
|
Value
|
|
Investment cost
|
$2950 per kW
|
|
Operational and maintenance cost
|
2% of investment cost
|
|
Lifetime
|
20 years
|
|
Discount rate
|
8%
|
Results: Mapping the Wind Energy Potential
The findings indicate a wind capacity factor ranging from 5% to 45%, reflecting variability due to local conditions. The average economic potential is estimated at approximately 428 kWh/m²/year, with some locations reaching up to 2100 kWh/m²/year under favorable conditions. These results shows the potential for wind energy to enhance Ethiopia's local energy mix.
Notably, approximately 10 million people reside in areas with an LCOE ranging from $0.20 to $1.00 per kWh (see Figure 2). While wind power may be less competitive compared to other renewable sources at the mini-grid scale in the Ethiopian context, it can serve as a valuable complement to solar photovoltaic (PV) systems, enhancing the overall energy mix for rural communities.

Figure 2: The spatial distribution of mini-grid wind LCOE.
The paper has now been published. The link is here: https://ieeexplore.ieee.org/document/10759497


